Transfer Test Tips – Conversion Graphs

Transfer Test Tips – Conversion Graphs.
This topic was new in the AQE in 2021 and had never appeared before so it is important that your child looks over it as it only appears in one past paper. Please read on to find out our transfer test top tips for conversion graphs.
What does my child need to know about Conversion Graphs?
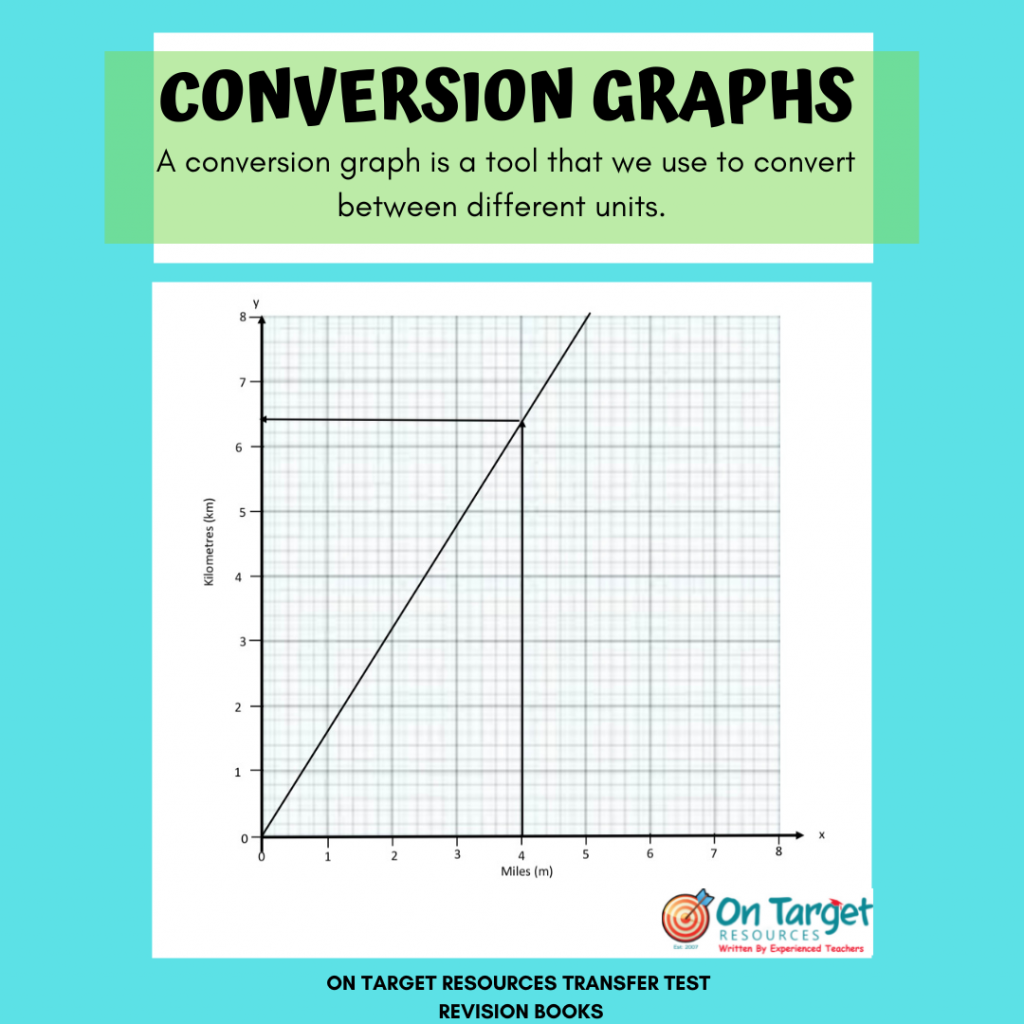
A conversion graph is a tool that we use to convert between different units. All graphs you
come across will be straight line graphs with one unit on the x axis (horizontal) and the other
on the y axis (vertical).
Look at the graph in the picture – To convert 4 miles into kilometres, start on the x axis and draw a vertical line from 4 miles until you meet the conversion line. Start from this point and draw a horizontal line until it
meets the y axis.
Check the scale. Each square is equal to 0.2 kilometres so the answer is 4 miles = 6.4 kilometres.
Conversion Graphs is taken from our Maths Revision Book 1– Data Handling.
It can be purchased as part of our complete Transfer Test Revision Book Package.
-
 Transfer Test Maths Revision Books£27.00 – £40.00
 -
 Transfer Test Maths and English Revision Books£42.00 – £60.00
Every year we update our Transfer Test Revision Books with new questions that have appeared in last year’s AQE test.
Our aim is to make sure we have the most up to date resources that cover the curriculum and we are committed to constantly updating and improving them year on year. Find out more about our Transfer Test Revision Books and Staged Difficulty Practice Papers on our website On Target Resources.


